It seems like the SEO community can’t stop talking about site speed and performance at the moment, and it’s no wonder seeing as Google’s Speed Update was officially announced on 9th July after months of build-up and speculation.
The Speed Update, which enables page speed in mobile search ranking , is now rolling out for all users!
More details on Webmaster Central https://t.co/fF40GJZik0
— Google Webmasters (@googlewmc) July 9, 2018
With this update from Google, it’s made many of us take a closer look at our websites and how quickly they load for users, as well as the user experiences we’re providing for our customers online. It’s more important than ever to have a solid understanding of site performance, however, this analysis can be difficult to scale with the tools available to us.
The most popular speed testing tools work on a per-URL basis, which can make your performance investigation a tedious and manual process. In our opinion, that isn’t good enough; so we’d like to share a way in which you can collect performance timings for all your pages at scale.
Using a crawler for performance analysis
By using a web crawler to highlight performance metrics instead of a testing tool that only analyses one page at a time, you can truly scale up your speed auditing process. A crawl only needs to be configured and started once, then it will return performance data for every page on your site. No more copying and pasting URLs into PageSpeed Insights or settling for a limited speed ‘spot check’ for your site which only includes a handful of template pages!
We recently launched our JavaScript feature release which allows you to render pages at scale. In case you didn’t know, our crawler uses Chrome as its renderer of choice, which comes with the added benefit of providing access to a number of page rendering performance data, including performance timings. This means our rendering service allows us to collect these metrics, and the way to do this is through the use of custom scripts.
What are custom scripts?
Custom scripts are snippets of JavaScript that are written to manipulate the page that our crawler will see when it renders your website. Once a page is rendered and loaded, the crawler will then execute whichever custom script you have added. This will only affect what is reported in your final crawl, and doesn’t make any changes on your site or to any other view of the site apart from our own.
Custom scripts are useful for helping DeepCrawl discover pages to crawl which might not have been found otherwise. For example, you can use custom scripts to extract onclick elements and find links that aren’t visible in the unrendered HTML.
There are many different ways you can use custom scripts, however, in this article we’ll be explaining how they can be used to inject elements into the rendered view of a page, such as Chrome performance metrics.
How to configure custom scripts in DeepCrawl
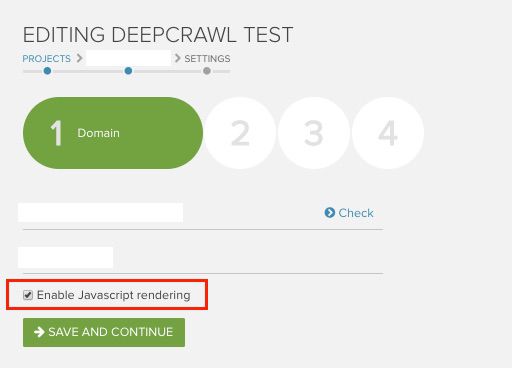
Before we walk you through how to use custom scripts within the DeepCrawl app, make sure that you have JavaScript rendering enabled for your crawl. You can do this by ticking the box in the first step of your crawl setup.
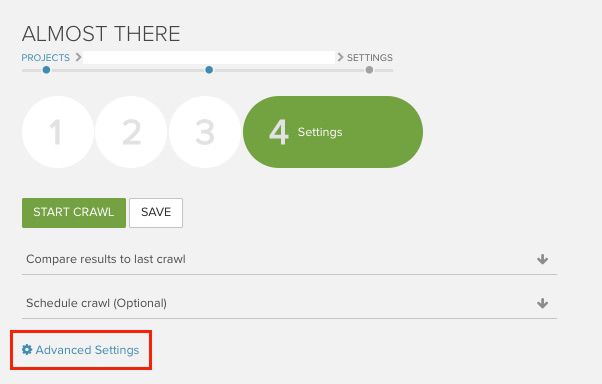
Next, you will be able to configure custom scripts in the fourth step of your crawl setup in the advanced settings.
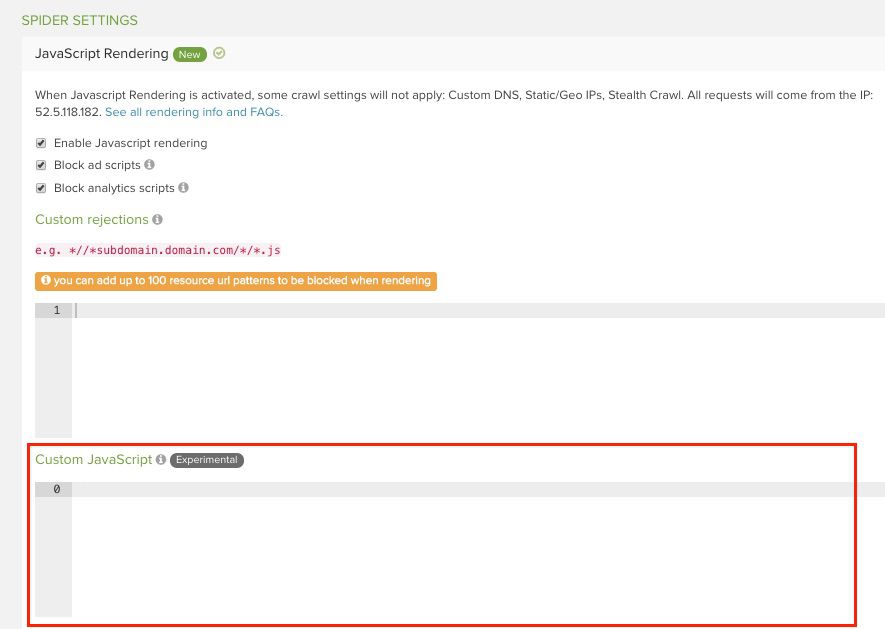
Then you go to the Spider Settings > JavaScript Rendering > Custom JavaScript, where you’ll find a blank box. This is where you add in custom scripts.
How to track performance metrics with a custom script
To show you how custom scripts can really work, let’s go through the process of extracting performance timings. This is a two-step process which involves injecting JavaScript and then using custom extraction to pull out the data we need in an easily understandable way.
As we’ve mentioned, by rendering with Chrome we have access to a variety of different timings, including:
- fetchStart
- requestStart
- responseStart
- responseEnd
- first-paint
- first-contentful-paint
- domInteractive
- domContentLoadedEventEnd
- domComplete
- loadEventEnd
For the full list of performance metrics available and the custom extractions you’ll need to extract them, make sure you take a look at our guide on getting page performance statistics.
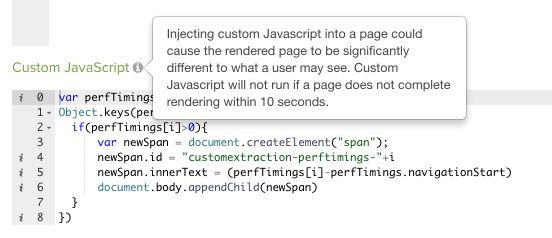
In order to collect this data, Alec Bertram, our resident JavaScript genius (nickname pending approval by Alec), has written a custom script snippet which you can use. Here is the full custom script you need to paste into the Custom JavaScript box in your crawl configuration to get performance timings:
var perfTimings=performance.timing.toJSON()
Object.keys(perfTimings).forEach((i)=>{
  if(perfTimings[i]>0){
      var newSpan = document.createElement("span");
      newSpan.id = "customextraction-perftimings-"+i
      newSpan.innerText = ((perfTimings[i]-perfTimings.navigationStart)/1000).toFixed(2)
      document.body.appendChild(newSpan)
  }
})
performance.getEntriesByType('paint').forEach(entry => {
          var newSpan = document.createElement("span");
      newSpan.id = "customextraction-perftimings-"+entry.name
      newSpan.innerText = (entry.startTime/1000).toFixed(2)
      document.body.appendChild(newSpan)
})
var deepCrawlResourceMetrics = {count:0,totalTransferBytes:0,totalDecodedBytes:0}
performance.getEntriesByType('resource').forEach(entry => {
    deepCrawlResourceMetrics.count++
    deepCrawlResourceMetrics.totalTransferBytes+=entry.transferSize
    deepCrawlResourceMetrics.totalDecodedBytes+=entry.decodedBodySize
})
Object.keys(deepCrawlResourceMetrics).forEach((i)=>{
    var newSpan = document.createElement("span");
    newSpan.id = "customextraction-resources-"+i
    newSpan.innerText = deepCrawlResourceMetrics[i]
    document.body.appendChild(newSpan)
})
Here’s how it will appear in the app:
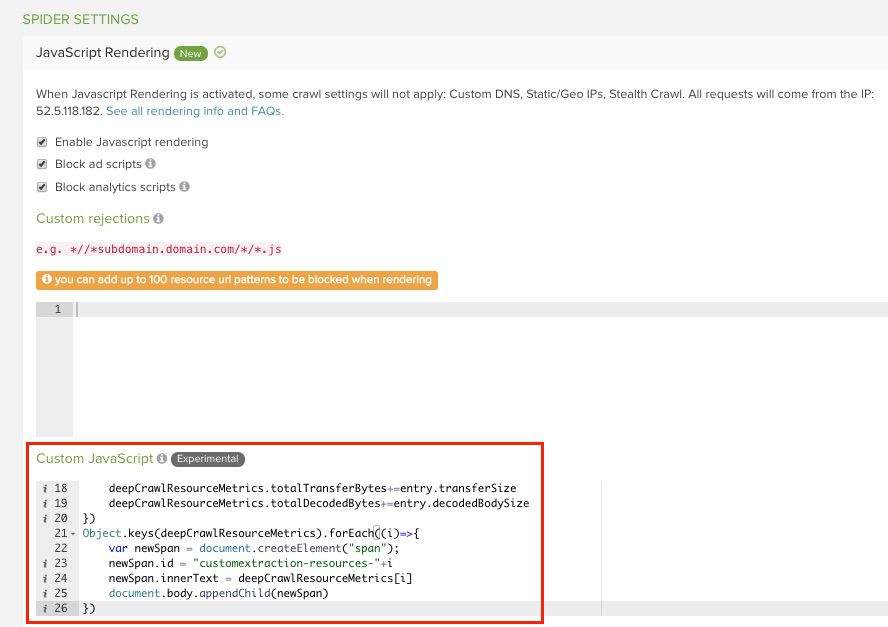
After adding in the custom script, you will then need to configure a simple custom extraction, which will pull out the metrics you want from the injected script and present them in a meaningful way. Be sure to read our detailed guide for more information on how to use DeepCrawl’s custom extraction functionality.
To configure custom extractions, you need to stay within the fourth stage of your crawl setup, but scroll down from the JavaScript Rendering settings until you find Extraction > Custom Extraction. This is where you’ll add in your custom extractions.
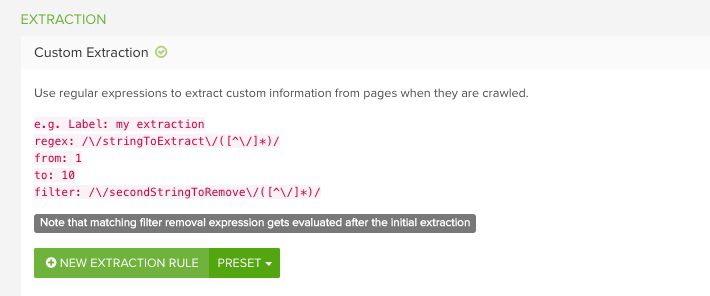
In this example, we wanted to extract two important performance metrics: First Contentful Paint (FCP), when the browser renders the first element of content defined in the DOM, such as some text, an image or a section of navigation, and DOMContentLoaded (DCL), the time taken for the initial HTML document and content of the DOM to be fully loaded and parsed, except for elements like images and iframes. These are two metrics that can be considered as the most important for speed rankings. Here are the full lines of regex for the two custom extraction examples you’d need for this.
FCP:
<span id=”customextraction-perftimings-first-contentful-paint”>((?:[0-9]|\.)*?)</span>
DCL:
<span id=”customextraction-perftimings-domContentLoadedEventEnd”>((?:[0-9]|\.)*?)</span>
Our guide on getting page performance statistics has the full list of custom extractions to pull out all the different Chrome speed metrics, so make sure you take a look. The method in this guide will work for any of them.
Here’s how the custom extractions will appear in the app once you’ve pasted them in:
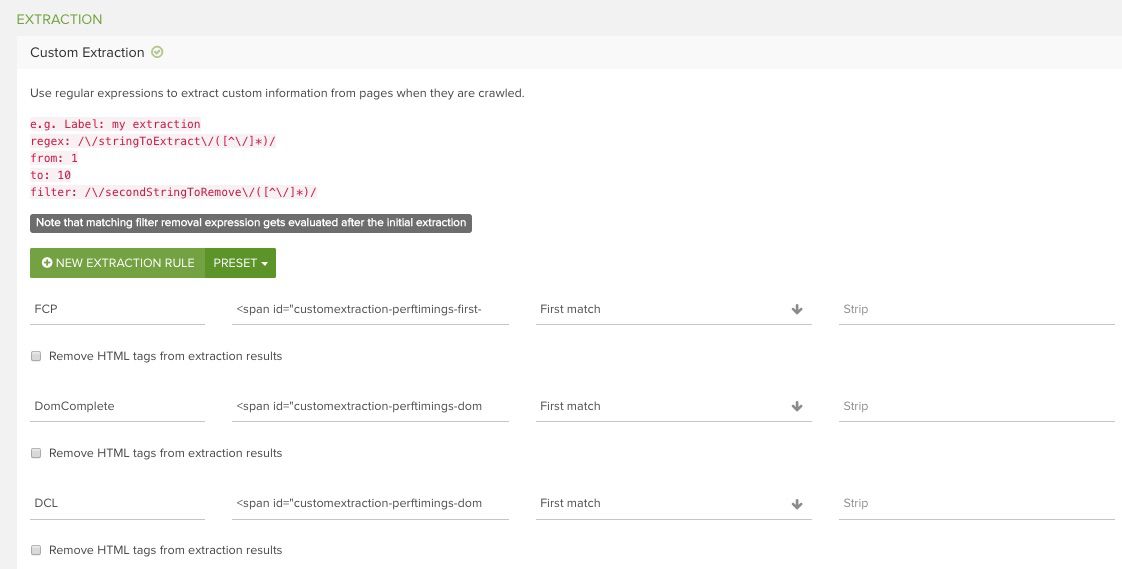
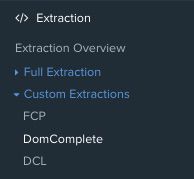
Once your crawl has finalised, your custom extraction titles will appear in the navigation of reports on the left-hand side of the app.
You’ll also be able to see the metrics in seconds since the beginning of the page load. This is how the final results appear:
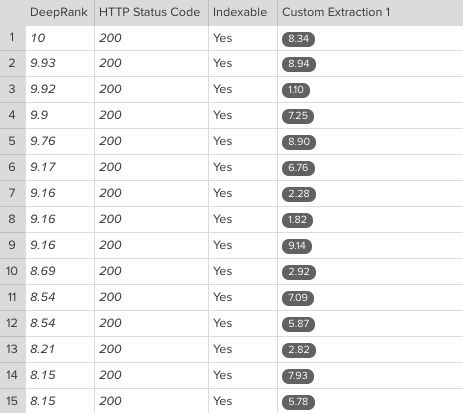
Here you can see it took between 6-8 seconds for FCP to be triggered for most of these pages – time to get down to some serious optimisation work! In the final step, you can easily export this data to Excel for further investigative analysis.
If you’d like to learn more about extracting performance timings for your website or other ways of using custom scripts, don’t hesitate to get in touch. We’ll be happy to help you explore the details of your website’s performance.
Learn more about site speed & performance
If you’d like to explore the topic of site speed and performance further, then we have some great resources for you. Not only did we host a webinar and Q&A with site speed expert, Jon Henshaw, but we’ve also published a comprehensive white paper which explains everything you need to know about optimising your site’s performance for speed.
In the guide you’ll learn all about the different site speed metrics and what they measure, which ones to prioritise for your website, as well as tips on the elements that have the biggest impact on speed, including JavaScript and images, and how to optimise them for a faster website.
