Everyone loves a customizable dashboard, so we thought we’d join the party.
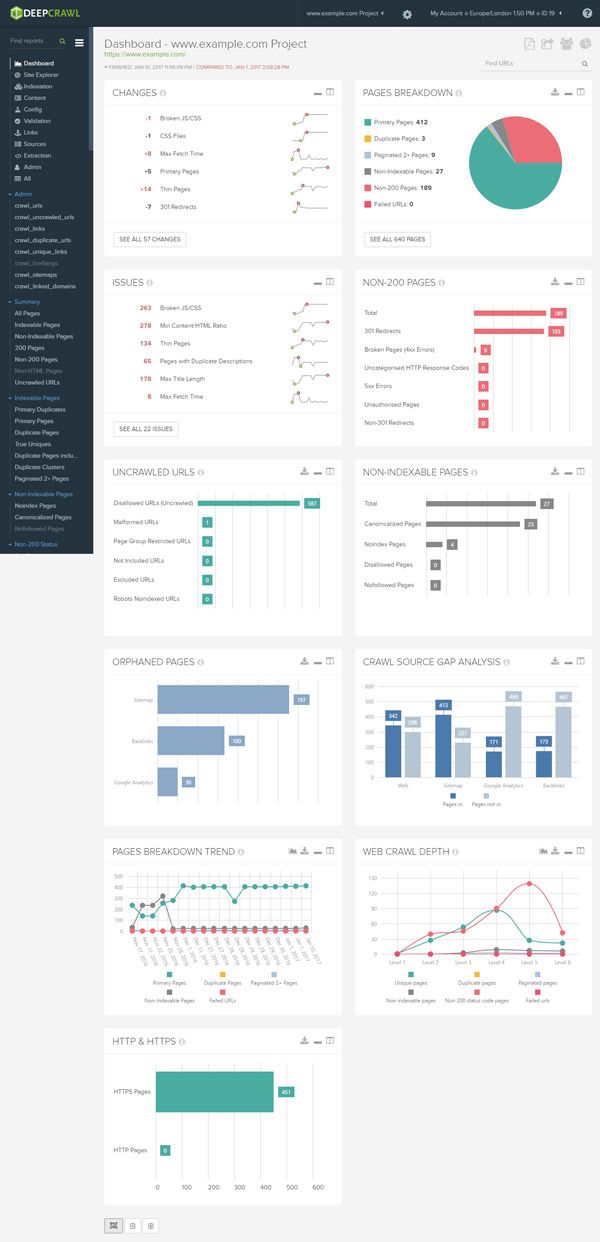
You can customize your dashboard layout, which will be shared across all your projects.
You can drag any chart on the dashboard and move it to a new location by clicking the title bar.
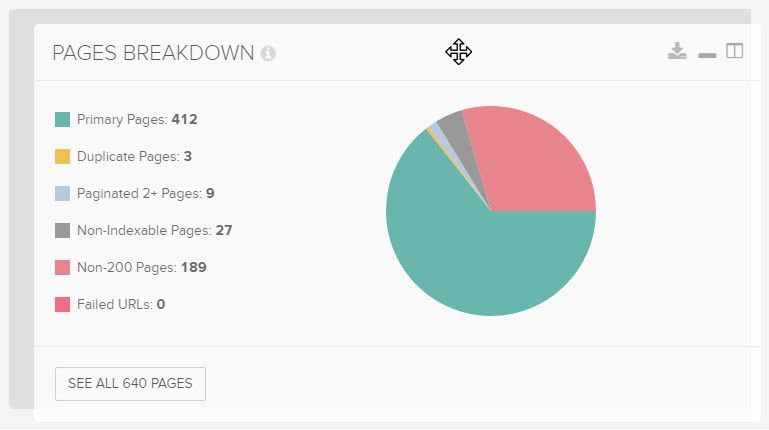
You can hide any chart using the minimise symbol. They can be added again by clicking the chart name at the bottom of the dashboard.

You can change the width of graphs to a wider format.

Whilst we’re chatting, you might not have noticed that some charts can be changed to a different type. Nice.
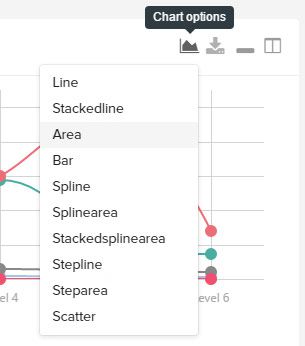
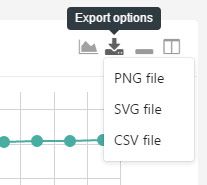
And downloaded in a bunch of different formats. Snipping tool be damned.
If you screws things up, just use the reset button to return everything back to the default layout.

The new layout makes it easier for us to add any new charts in the future, so let us know what other information you’d like to see.
See you at the party Richter!

