Site Explorer was a popular feature in DeepCrawl 1.9 which didn’t make it into the release version of DeepCrawl 2.
It’s a tree summary report of all the URLs included in the crawl, based on the URL structure. Each path in the URL, starting with / or parameters starting with ? or &, creates a new entry in the tree, and all the URLs located under the same path are grouped together.
Although a URL structure doesn’t necessarily represent the site’s architecture, which is primarily defined by internal linking, it’s often used to organise pages and so it’s a helpful way to analyse patterns of URLs which share the same issues.
Where to Find Site Explorer
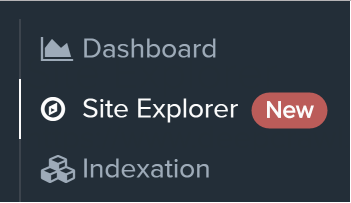
You can reach the Site Explorer by selecting it from the left hand menu when looking at any crawl report which has been run since the release. It won’t be available for any crawls completed before we started generating the data in mid-november.
How to Use Site Explorer
- The URLs metric shows the total count of all URLs contained in the path, including those located on the root of the path, and other URLs located in sub-paths.
- Root URLs metric is a count of the URLs located directly on the path, excluding URLs in paths further down the tree.
- Either of these metrics can be clicked to see a report showing the list of URLs.
- Clicking a path will reveal any more child paths located underneath it.
- Clicking a column heading will sort the list of paths by that metric.
Site Explorer Modes
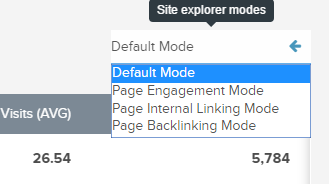
You can change the mode of Site Explorer using the drop down selection located above and to the right of the path tree.
The default mode gives a number of general metrics, but we provide a different set of metrics to solve different issues.
The Internal Linking mode gives a variety of linking metrics including the average number of followed links in, and links out on each page. These metrics can be used to help identify areas of the site which are underlinked.
The Engagement mode appears if you include analytics data in your crawl setup, and includes traffic metrics alongside engagement metrics like bounce rate and time on page. This can help you find areas of the site which are negatively affecting the overall quality of your site.
The Backlinking Mode appears if you include backlink data in your crawl setup, and displays average number of linking domains and backlinks per page. This can help you understand which parts of the site are generating the most backlinks.
Metrics
This is a list of the current metrics available across the different modes.
Fetch Time (AVG)
The average time that it took to retrieve each page.
Followed Links in (AVG)
The average number of followed links to each page found on other internal pages.
Time on Page (AVG)
The average page load time as reported in the analytics data source.
Views/Visit (AVG)
The average number of pageviews as reported in the analytics data source.
Bounce Rate (AVG)
The average bounce rate as reported in the analytics data source.
Visits (AVG)
The average number of visits as reported in the analytics data source.
Visits (SUM)
The total sum of all visits as reported in the analytics data source.
Int. Links in (AVG)
The average number of links out to other internal pages.
Links in (AVG)
The average number of links in, found on internal pages.
Links out (AVG)
The average number of links out to internal and external pages.
Words (AVG)
The average number of words found in the HTML body.
Backlinks (SUM)
The average number of backlinks as reported in the backlinks data source.
Followed Ext Links (AVG)
The average number of followed links to external domains.
Backlink Domains (SUM)
The average number of referring domains as reported in the backlinks data source.
Your Thoughts and Feedback
This is just the first phase of Site Explorer, and we’re already planning a bunch of improvements. We’d love to get your feedback on the current version and input on metrics and new modes you’d find useful, so please drop an email to support@deepcrawl.com with your thoughts.


