Chapter 4: The Main Issues to Watch Out for on JavaScript-Heavy Websites
We’ve explored the different pitfalls of JavaScript-powered websites to watch out for, but how do you know if these issues are impacting your website? Thorough testing and auditing is essential for demystifying how your site renders and determining what is and isn’t available for the different rendering capabilities of users and search engines.
We have to change the way we analyse websites technically and also the way we think about crawling and indexing. A few years ago, we would disable JavaScript in our browser to get an idea of how Google “saw” the websites we were working on. Now, we have to be aware of the differences between the raw HTML we find at “show source code” and the rendered HTML we find at “inspect” in our browsers and how these differences affect the crawling and indexing of our websites.
We also need to learn how Google deals with these differences and which mechanisms it applies when crawling and indexing the web. More work needs to be done to analyse differences in the frequencies of HTML crawling and rendering. Solutions have to be developed for better tracking Google’s crawling and rendering activity. This will help with understanding how and when changes that are only made to the rendered version of a page, but not to the source HTML, can have an impact on Google’s search results.
The SEO industry as a whole faces the same issues as Google when it comes to keeping up with the rapid pace that web development is evolving at. We need to keep moving fast, in order to be able to continue delivering outstanding results.

What to test for in a JavaScript audit
When running a JavaScript audit for a website, it’s important to focus on these main areas:
- Differences in the HTML content before and after the DOM is rendered: Make sure key content is included in the DOM before rendering, and check that JavaScript isn’t removing any of your content or links after rendering.
Some JavaScript removes content from the page rather than adding it, which prevents us from indexing the content.
–Google Webmaster Central Blog
- Check that URLs and content are being indexed: Use the site: or site: “” command to see if the URL itself or a section of text from the page is being indexed. Try this in incognito mode too in case caching affects the results.
- Test rendering on different devices: Pay attention to the rendering capabilities of the devices most commonly used by your site’s visitors, especially the ones with lower-end CPUs. These tests will also show how dynamically rendered content appears for different devices and viewports.
- Google’s crawling and rendering capacity: Look at log file data to see where Google and other search engines are having difficulty in accessing your pages that rely on JavaScript. Compare which ones can crawl normally and which ones are struggling.
- The speed of rendering: If it takes too long for the resources on a page to be rendered, this will impact user experience and prevent Google from being able to index your content.
If you’re sure that your code works for Googlebot (a quick way to test is the mobile-friendly test), then it’s worth estimating if speed of processing might be an issue. My way of eyeballing it is to see how long the mobile-friendly test roughly takes, and to check with webpagetest.org to see how long a page might take to load the critical / unique content, and how many resources are required to get there. The more resources required, the longer time until the critical content is visible, the more likely Google will have trouble indexing the critical content.

Some of the key things to watch out for when testing rendering are differences between unrendered and rendered content, rendering speed and indexing issues.
Tools for analyzing JavaScript
Here is a list of 10 of the main tools you can use to analyze and debug JavaScript issues on your site:
- URL Inspection Tool
- Mobile-friendly Test
- Rich Results Test
- Google Search Console
- PageSpeed Insights
- Diffchecker
- Chrome DevTools
- Web Developer Extension
- WebPageTest
- Lumar
For more detail on each of these tools and their highlight features, take a look at this guide on tips and tools for testing rendering.
JavaScript rendering doesn’t have to remain a mystery. There are a number of tools out there that can help you analyze and debug JavaScript on your site.
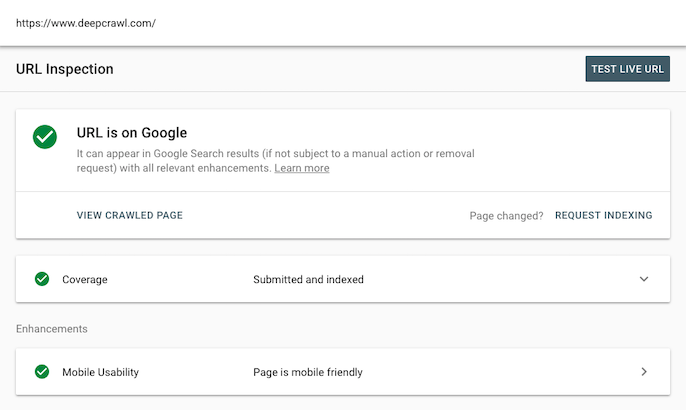
URL Inspection Tool
Google’s URL Inspection Tool shows details about the issues preventing a page from being indexed, as well as what Google found when it tried to crawl and render a page. You can even run live tests for URLs to see how Google handles them in real-time. This is helpful to be able to test because Google’s index often uses caching so it can be difficult to see if particular fixes have worked.
When you run a live test of a URL, you can see resources that were blocked as well as JavaScript errors that were encountered. This section of the tool is especially useful for debugging.
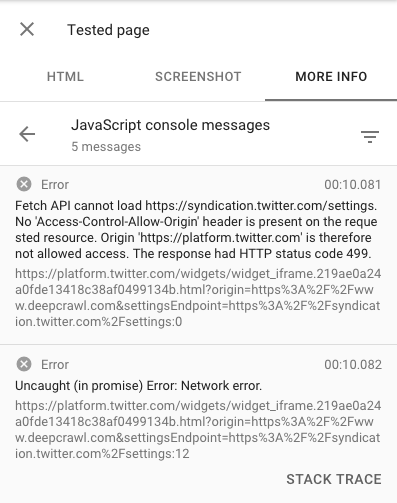
The JavaScript console messages even provide stack trace reports which allow developers to see where errors are happening in the code and debug them.
Remember that the results you see from Google’s tools may not reflect real rendering. These tools have a shorter timeout as they aim to give results to their users as quickly as possible. Google’s indexing systems will wait for a page to render for a longer period of time.
Google’s indexing systems are more patient with rendering than the live testing tools are.
-John Mueller, Google Webmaster Hangout
Mobile-friendly Test
The Mobile-friendly Test shows the rendered HTML of a page so you can check that everything is showing properly and making sense for Google. It lists different elements that could negatively impact how your site appears on mobile devices, such as blocked resources and JavaScript errors.
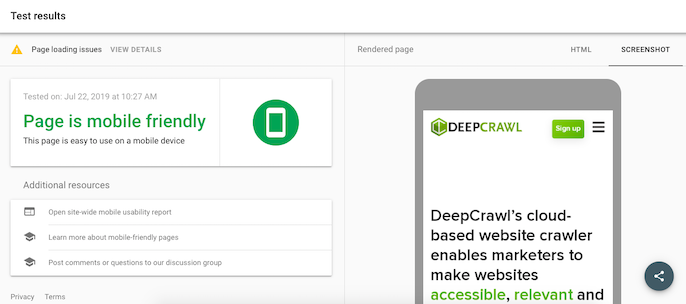
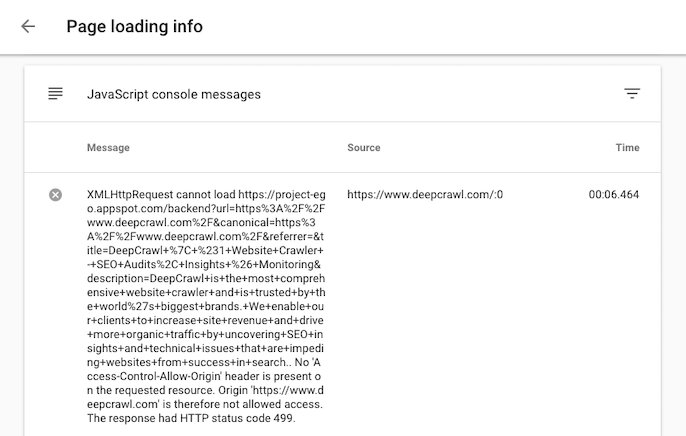
Use the mobile-friendly test and the Googlebot user agent in the browser to check for rendering issues.
-John Mueller, Google Webmaster Hangout
Rich Results Test
The Rich Results Test can also be used to see how Google renders a page and how it handles different JavaScript frameworks. This tool can be used for testing rendering on a page-by-page basis.
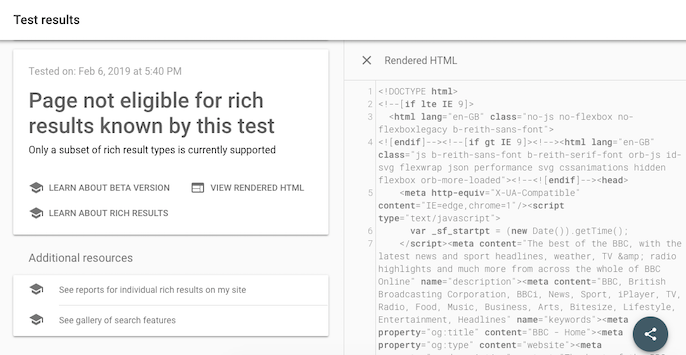
Test JavaScript frameworks with the Rich Results feature in Google Search Console.
-John Mueller, Google Webmaster Hangout
Google Search Console
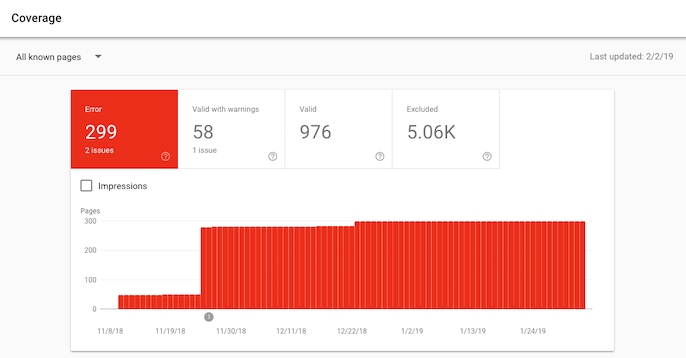
The Index Coverage report in Google Search Console is useful for getting an overview of what is and isn’t being indexed on a website. Whereas some of Google’s other tools can provide granular information on errors at a page-level, this top-level view can give valuable insights into more widespread issues with JavaScript that could be impacting indexing across the site.
PageSpeed Insights
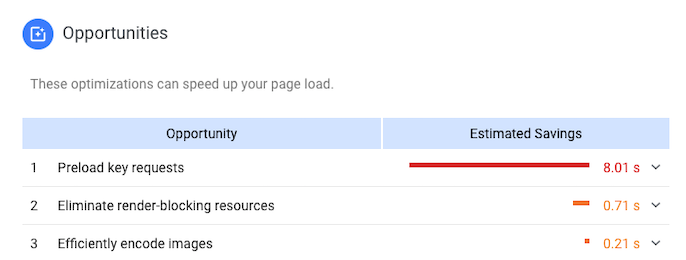
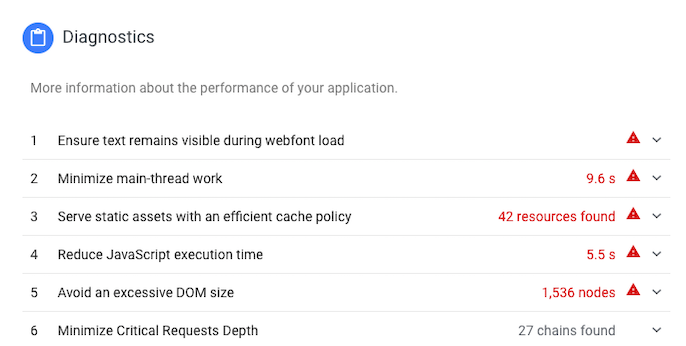
The PageSpeed Insights tool has been revamped to include Lighthouse data and a variety of new performance and JavaScript-related reports. The ‘Opportunities’ and ‘Diagnostics’ sections show key issues that need to be addressed, as well as how much time could be saved on page load time if they were fixed.
Diffchecker
Diffchecker allows you to analyse the differences between the unrendered source code of a page side by side against the rendered DOM. This allows for detailed comparisons between rendered and unrendered content on a page-by-page basis.
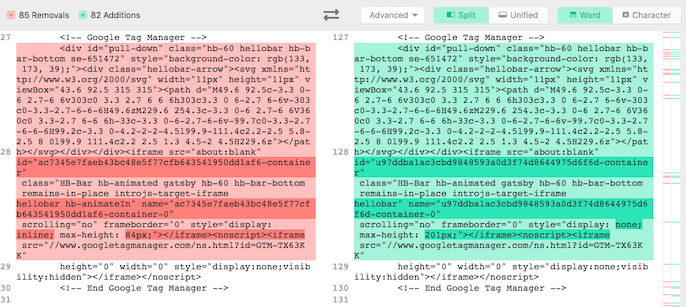
You can copy the HTML that is shown once you right click and select ‘View Page Source’ in the browser and paste this in the ‘Original Text’ box in Diffchecker. Then copy the ‘outerHTML’ after right clicking in the browser and selecting ‘Inspect’, and paste this code in the ‘Changed Text’ box. Diffchecker will then show you any differences between the two sets of code.
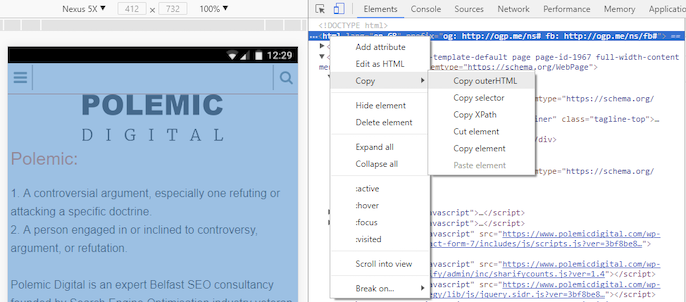
Source: Polemic Digital
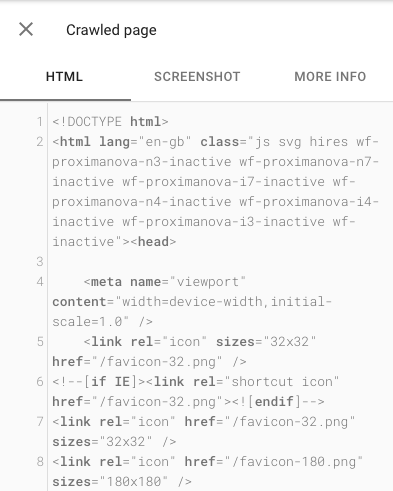
You can also compare the difference between the unrendered and rendered code that Google displays in the URL Inspection Tool. Firstly, copy all of the ‘Crawled page’ HTML and paste it into the ‘Original Text’ section in Diffchecker. This is the source code.
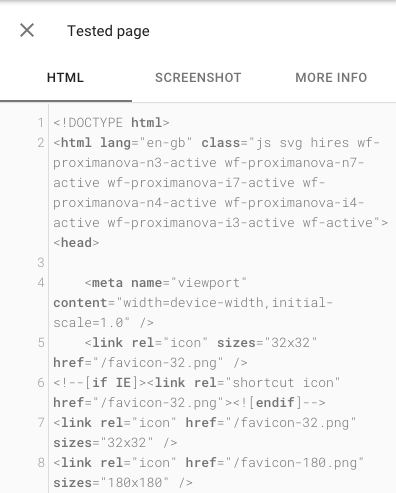
Then copy all of the ‘Tested page’ HTML and paste it into the ‘Changed Text’ section. This is the rendered HTML.
Chrome DevTools
Chrome DevTools can be used to debug and edit pages within the Chrome browser. By right-clicking on a page when viewing it and clicking ‘Inspect’, the DevTools dock will appear with a wide variety of analysis options, such as monitoring performance and network conditions as well as showing JavaScript and resource errors.
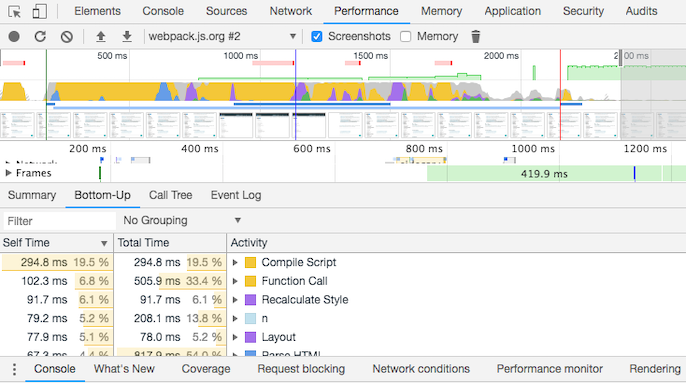
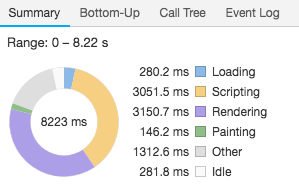
The ‘Performance’ tab shows a log of the activity that occurs when a page is loaded, including a summary of how long is spent loading, scripting, rendering and painting the page. Watch out for spikes in orange and purple within your page’s loading activity, as these colors relate to scripting and rendering respectively.
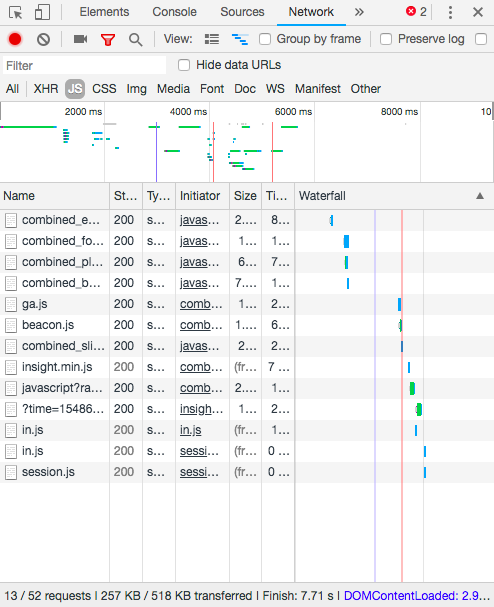
The waterfall under the ‘Network’ tab shows exactly which scripts were run and in which order, visualizing dependencies and roadblocks to be addressed. This is a really useful report as you can see the Load Event as a red line, which is the point when Google determines that rendering has been completed and takes a snapshot of the rendered HTML. Any content produced by resources that load after this point may not be seen. Focus on getting key content to load before this red line so Google won’t miss it.
JavaScript-powered content is indexed depending on whether it is visible to Googlebot on page load.
-John Mueller, Google Webmaster Hangout
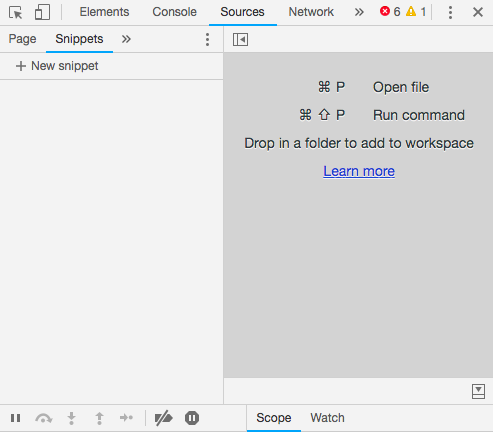
You can also test how JavaScript executes in the browser by running particular snippets. Select ‘Sources’ and ‘Snippets’ to add and observe how the code affects a page.
Chrome DevTools can also be used to find unused JavaScript code. This is incredibly useful for highlighting what users actually need from a page and areas where the amount of code can be trimmed down to speed up the page. The ‘Coverage’ tab shows how many unused bytes there are, as well as a comparison between how much JavaScript was executed as opposed to how much was actually loaded.
Tip: Chrome can measure how much unused JavaScript is on your page https://t.co/AYBKnPha0n
DevTools > top-right menu > More tools > Coverage pic.twitter.com/JpslYAuGvf
— Addy Osmani (@addyosmani) January 16, 2019
You can even test how your website renders across different devices with the ‘Device Mode’ in Chrome DevTools. Select from a list of different devices, or even add your own custom devices to test.
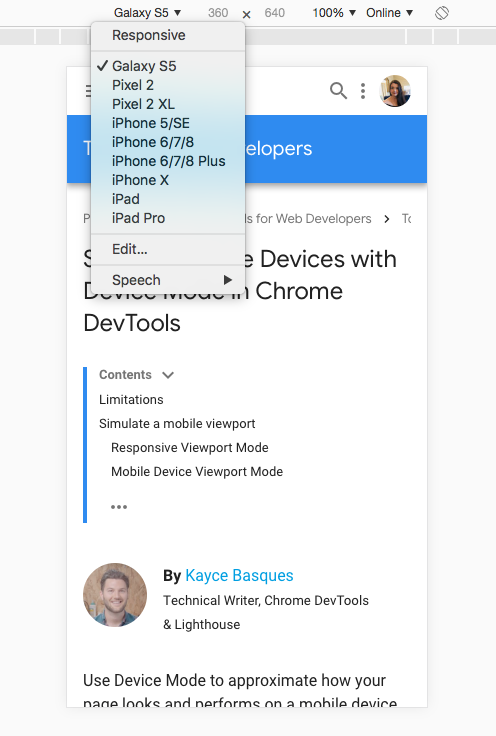
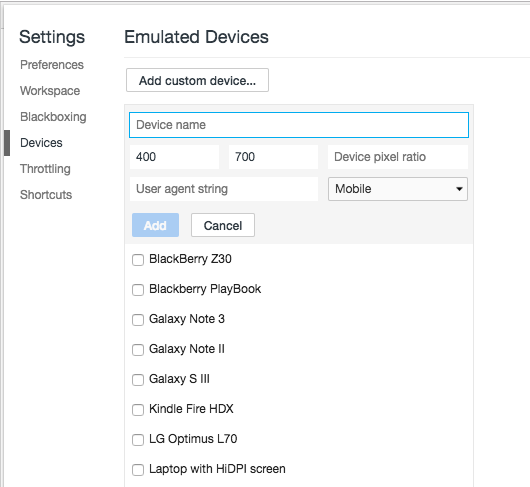
Chrome isn’t the only browser that provides JavaScript debugging functionality, there are also developer tools available for the main browsers such as Firefox, Opera and Safari, so you should be able to find a solution for JavaScript analysis that works for you.
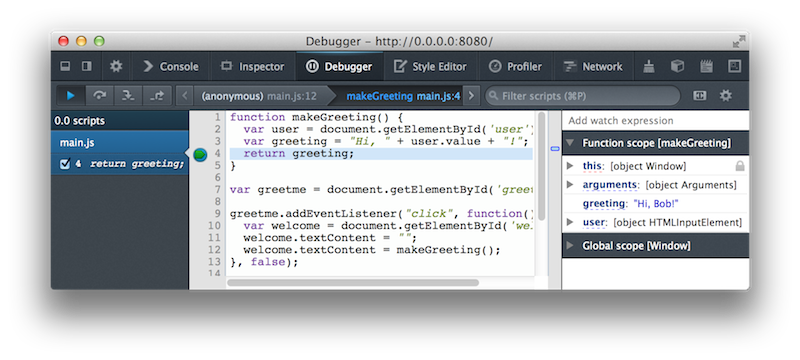
Source: Firefox Developer Tools
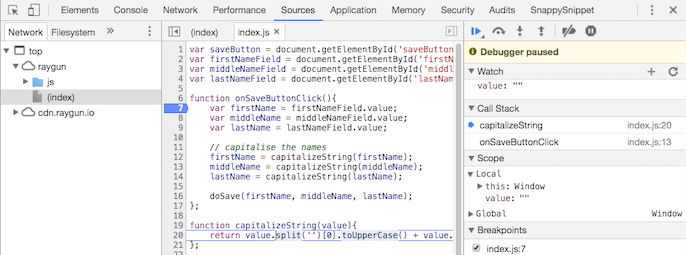
Source: Opera Developer Tools
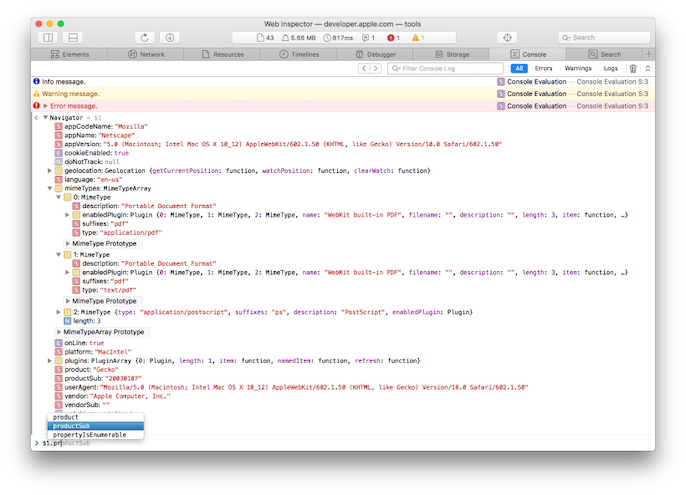
Source: Safari Developer Tools
Web Developer Extension
An easy way to see what works and what doesn’t work without JavaScript rendering is to use the Web Developer Extension to disable JavaScript in the browser. This will show you what can function and be displayed in the browser without the page being rendered. This extension can be used on Chrome, Firefox and Opera.

WebPageTest
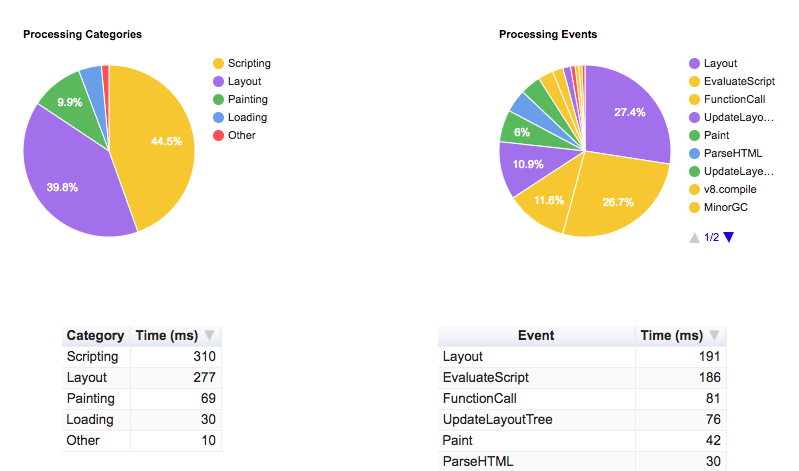
WebPageTest provides insights into the different types of resources on a page and how quickly they are able to be processed. This tool can give you an idea of how much time is spent on which stages of JavaScript rendering on a page-by-page basis, so you can spot patterns of performance issues and bottlenecks.
The ‘Request Map’ is a great feature as it shows all of the different requests made on a page and the dependencies between them. Each circle is a different request and you can see what type of resource each one is when you hover over them, such as JavaScript or an image. The larger the circle, the larger the resource in bytes. For example, the large green circle in this example is a JavaScript file which is the largest resource on the entire page.

The Request Map is color-coded by the host of the resource by default, however, you can add the simple parameter ?group=mimeType to the end of your Request Map URL to color-code by resource type instead. This makes the process of spot-checking JavaScript resource performance much easier.

Lumar
Lumar is a website crawler that can render JavaScript like search engines can by using its own Page Rendering Service (PRS). This allows you to monitor rendering and resource issues at scale, rather than having to analyze them on a page-by-page basis. The tool shows you whether or not links and content modified by JavaScript can be crawled and indexed by search engines.
With JavaScript rendering enabled in the project setup, you’ll be able to see reports on the number of JavaScript files you have on your site, broken or disallowed JavaScript files, JavaScript redirects and more.
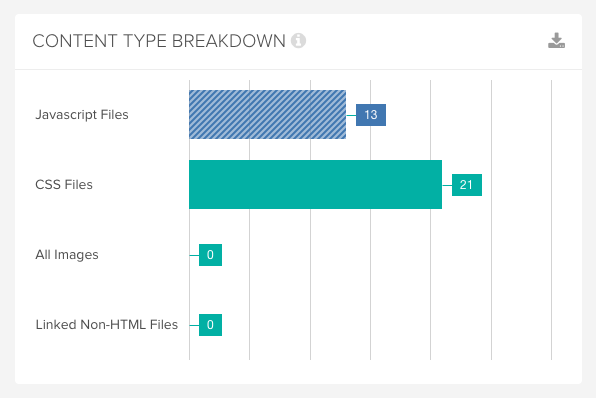
The key things to watch out for within your crawls are thin pages and low internal linking as this gives an indication of important elements that are being hidden from search engines.
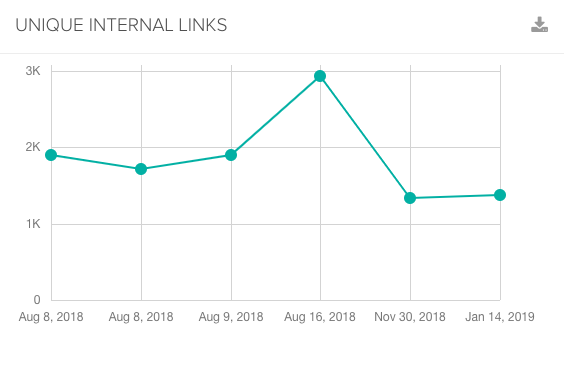
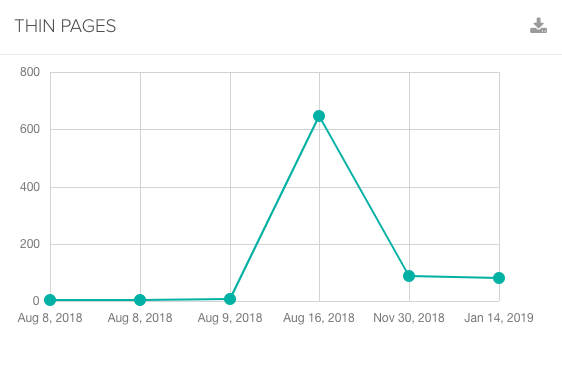
Also, watch out for pages that exceed the maximum file size as this could prevent browsers and search engines from being able to process them.
You can run comparison crawls with and without JavaScript enabled to compare how much content and how many links couldn’t be found without the crawler rendering JavaScript. This highlights the pages that are most at risk of performance issues for the search engines and social media platforms that can’t render.
Bonus tip: Use the Tasks Manager to set up email alerts for key metrics around low word counts, low numbers of internal links and maximum page file size, so you can be the first to spot rendering issues before they start impacting users and search engines.
Lumar also has a custom JavaScript feature that allows you to either inject changes or remove things from DOM while the tool is crawling your site. This feature can be used to report on a number of JavaScript issues, such as:
- Speed and performance metrics
- Which frameworks are being used
- Iframes and scripts in the head
- External files
- Resource counts
To find out more about Lumar’s JavaScript rendering capabilities, simply get in touch with our team. If you want to try out these features yourself then sign up for an account today.
A reliance on client-side JavaScript means a delayed and inefficient indexing process, plus a plethora of related repercussions such as poor flow of internal link value and potential conflicts between pre- and post-rendered content.
The best solution is to prevent the problem entirely in the first place. Make sure a webpage’s content, links, and relevant meta data is present in the raw HTML source and doesn’t rely on any client-side JavaScript. Progressive Enhancement is a great approach, where the webpage’s base content is in the HTML and JavaScript is then used to enhance the page’s functionality.
To test how your site’s reliance on JavaScript could impact on your SEO, you can use crawling tools that allow you to compare raw HTML to rendered code (such as Lumar). Significant variances between the HTML and fully rendered page could point to possible problems with Google’s crawling and indexing of your site.

Chapter 6: Tips for Optimizing JavaScript-powered Websites

