Our team has been working on a super exciting new project that we’re looking forward to telling you all about very soon. But they’ve also found time to make a few other improvements in the meantime. Here’s a look at some of the recent improvements we’ve made to the Lumar platform.
General
Account Admin Redesign
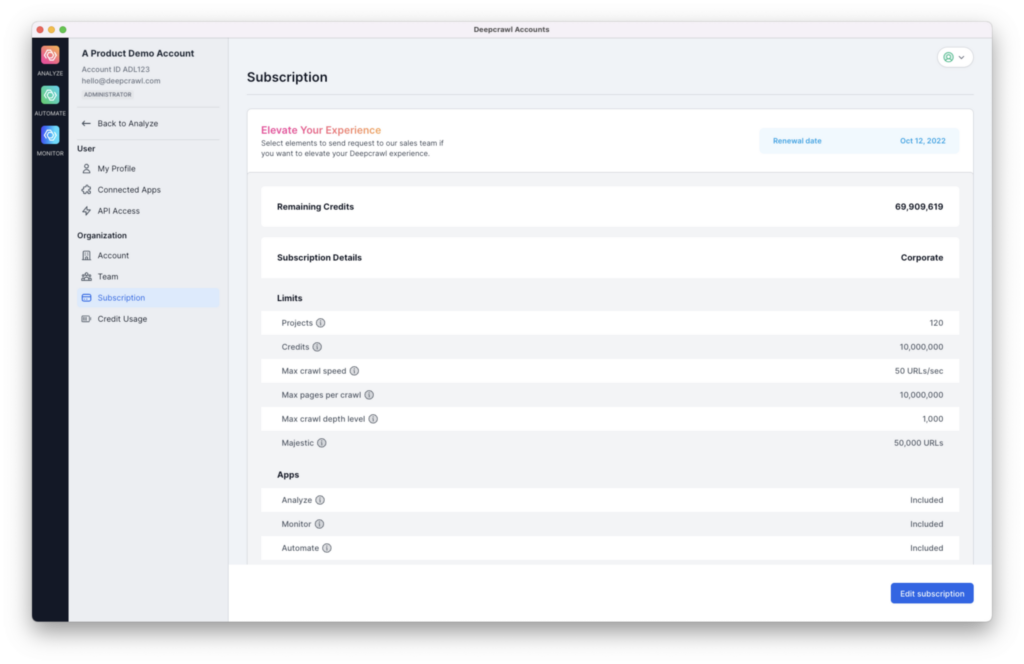
It’s been a few months now since we unveiled our sleek new look, but the keen eyed among you might have noticed that the Account Admin had been resisting change. Well, we’re pleased to say that it has now fully jumped on board and has the same great look as the rest of the Lumar platform.
You’ll be pleased to know that the functionality remains pretty much the same, so things will work in the same way as you’re familiar with. The only exception is the subscription page, where we’ve improved the layout, so it’s easier for you to see your current subscription and request changes.

Analyze
New Source Overlap Chart
A few months back, we added some more charts to the Log Files category, to increase the analysis and insights you get from log files.
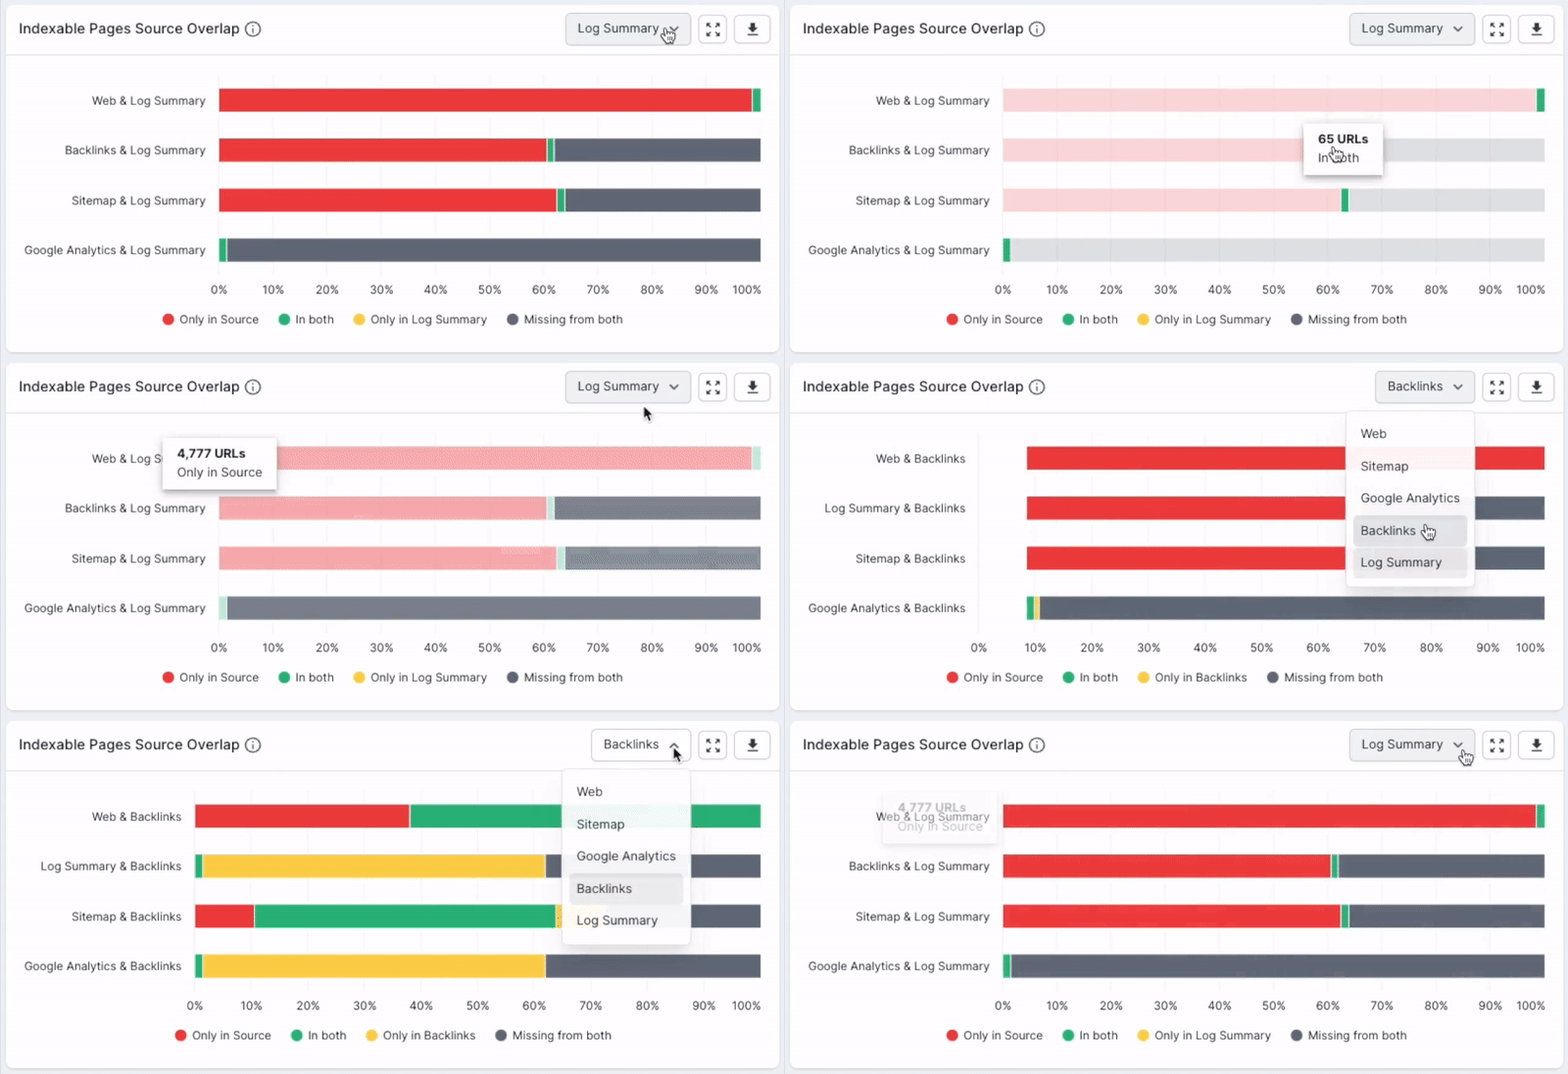
One of the new charts was the Indexable Pages Source Overlap designed to identify groups of indexable pages that are only in the primary source, or only in compared sources. The original version of the chart was a venn diagram which, while looking great, actually turned out to be not so useful.
So, we’ve created an all new Source Overlap Chart (which you’ll find on the Log Files Overview dashboard). Not only is it now much more useful, it still looks pretty good too.

Improved Projects View
Finally for Analyze, we’ve made a few improvements to the Projects views. First we’ve added the website Favicon to make different domains more distinctive (you’ll also see this in project search). The status tags have also been updated to make it easier to differentiate between different crawl statuses.
We’ve also updated the details that you’ll see on the ‘Running Crawls’ screen, to provide more useful information about the crawl progress, including the crawl speed and the number of URLs crawled.

Monitor
Smart Alerts
Back in May we announced the latest addition to the Lumar platform – Monitor – designed to drastically cut time spent monitoring multiple domains or large, complex websites. As well as providing a high-level overview of all domains or site sections in one place, Monitor includes customizable alerts based on the reports available in Lumar, delivered via email, Slack or Teams.
We’ve had some really positive feedback on Monitor since we launched, but one area that we were encouraged to look at was around the maintenance of alert thresholds, which was a bit of a daunting prospect for those managing multiple sites who are likely to have a number of alerts that need maintaining.
So, let us introduce you to Smart Alerts! Now you can allow Monitor to automatically set new thresholds for your alerts, based on recent crawl data. Now, we appreciate that some alerts might be so important that the thought of a machine automatically updating settings might bring some people out in a cold sweat. But worry not. For each alert you can choose whether to use Smart Alerts or not, and whether to use them for when an issue gets better, worse or both. You can even get Monitor to suggest the new thresholds to you, and manually accept or reject as necessary.
Find out more about Smart Alerts in our Monitor Getting Started Guide.

Coming Soon…
New Report Categorization
With so much data available in Lumar, we’re always looking at ways we can improve how the data and reports are laid out in the platform. To this end, our team has been putting a lot of time and brain-power into devising a new, improved categorization structure for the Lumar reports, which will make it easier to identify issues and dive into the data to diagnose. It will also create opportunities for us to deliver new views and insights.
But don’t panic – we’ll be giving you the opportunity to toggle the new categorization structure on and off, so you’ll have time to explore at your own pace.

